Inflation – A handy guide
The basics of Inflation
Inflation is the rate of increase or decrease in prices over a specific period of time. It indicates how much more expensive or cheaper a particular set of goods and services has become over a certain period, like a quarter or a year.
In India, inflation is calculated on wholesale goods as well as the consumer basket of goods. Inflation is calculated on the former by tracking changes in the Wholesale Price Index (WPI). This index measures the change in price of goods that are traded in bulk, usually between businesses. For example, change in price of coal, electricity, manufacturing of textiles, motor vehicles etc are all considered while calculating the WPI.
Consumer Price Inflation
For the common man, it is the Consumer Price Index (CPI) which is the more relevant tracker of inflation. The CPI measures the change in price of goods and services that is commonly consumed by households.
The CPI basket of goods and services as well as their corresponding weights are as below.
| Sl. No. | Components | Weights (%) |
| 1. | Food and beverages | 54.2 |
| 2. | Pan, tobacco and intoxicants | 3.3 |
| 3. | Clothing and footwear | 7.4 |
| 4. | Fuel and light | 7.9 |
| 5. | Miscellaneous | 27.3 |
| Total | 100 |
Calculating CPI
Let’s take a look at an example to better understand how inflation is calculated for a basket of goods.
The percentage change in price for an item is calculated as :
(Price at time 1 – Price at time 0 / Price at time 0 ) * 100.
Suppose the price of 1 kg apple on 1st Jan 2019 was ₹20 and on 1st Jan 2020 is ₹30 the price percentage change between the 2 dates is ((30 – 20) / 20 ) * 100 = 50%. Let’s assume that during the same period the price of electricity increased by 10%. An individual spent a total of ₹100 on both these products during the year – with the break up being ₹70 on apple and ₹30 on electricity. Hence the weight of the apple in the basket is 70% (70/100) and the weight of electricity is 30% (30/100). Using these weights the change in price of basket of goods, containing electricity and apple, is calculated as (30% * 10%) + (70% * 50%) = 38%.
The same principle is applied to calculate consumer price inflation.
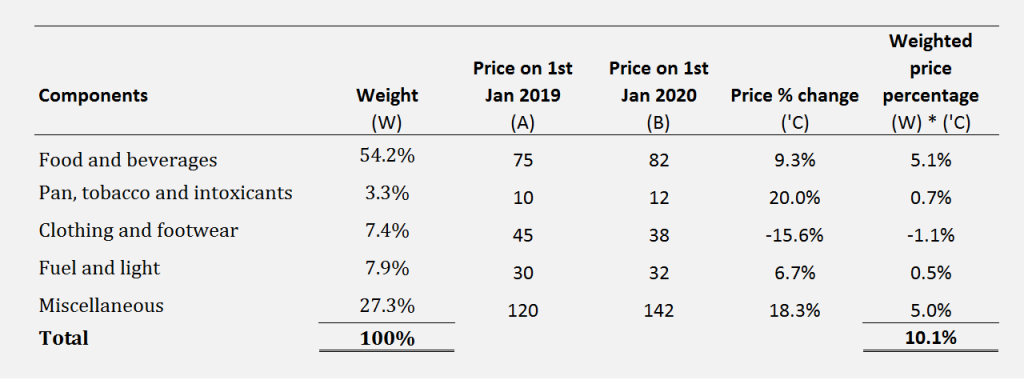
Between 1st Jan 2019 and 1st Jan 2020, the price of the representative basket of goods and services increased by 10.1%. This means that the consumer price inflation, which is calculated using the representative basket of goods and services, increased by 10.1%.
Headline Vs Core Inflation
The headline inflation measures the overall inflation in the economy across all goods and services. 10.1% calculated in the above example is the headline inflation.
The above CPI component table has a wide variety of goods and services. The prices of some of these goods like fruits, vegetables, cereals, eggs, meat etc listed under food and beverages is susceptible to supply shocks caused due to rainfall, volatile movement in oil price etc. Due to such shocks, the prices of these goods record extreme, but temporary, movements within a short period of time.
Hence in order to distinguish inflation signals from transitory noise, price of highly volatile items like food and fuel is removed in order to calculate core inflation.
What causes inflation?
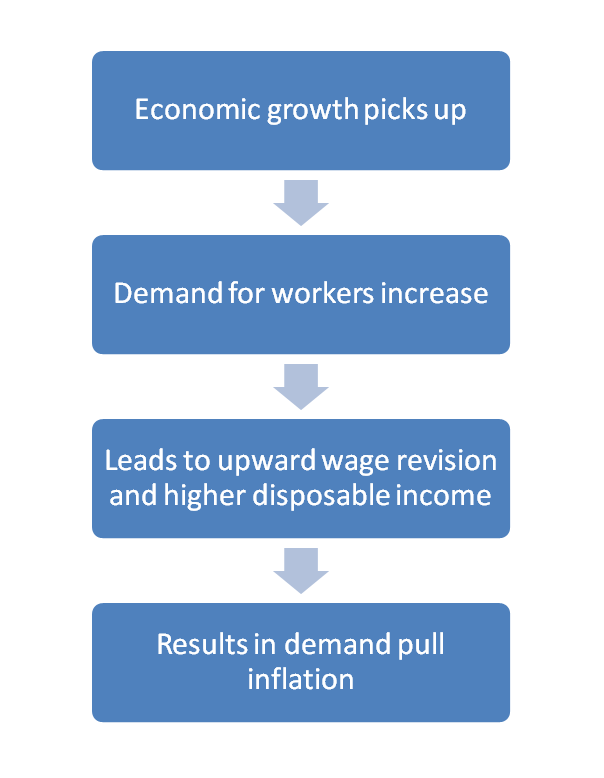
Demand pull Inflation
- This is most commonly referred to as “too much money chasing too few goods.” It occurs when the economy is growing too fast and aggregate demand in the economy outpaces total supply of goods.
- When the economy grows fast, companies employ more workers and produce more goods. Due to increased demand for workers, wages start rising. Rising wages results in higher disposable income, which leads to increased spending and higher inflation.
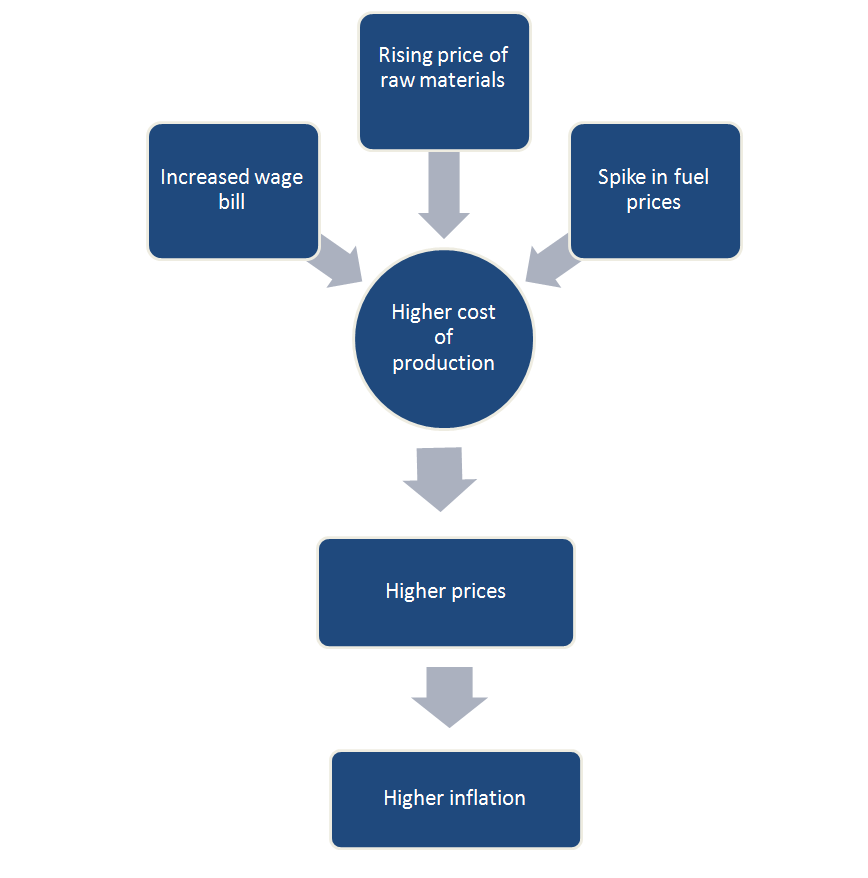
Cost push Inflation
- Higher cost of raw materials like increased wages and spike in fuel prices often push up the aggregate cost of production leading to higher prices and higher inflation.
- Cost push inflation is caused by supply side factors unlike demand pull inflation.
- In an extreme situation cost push inflation can lead to a drop in economic growth.
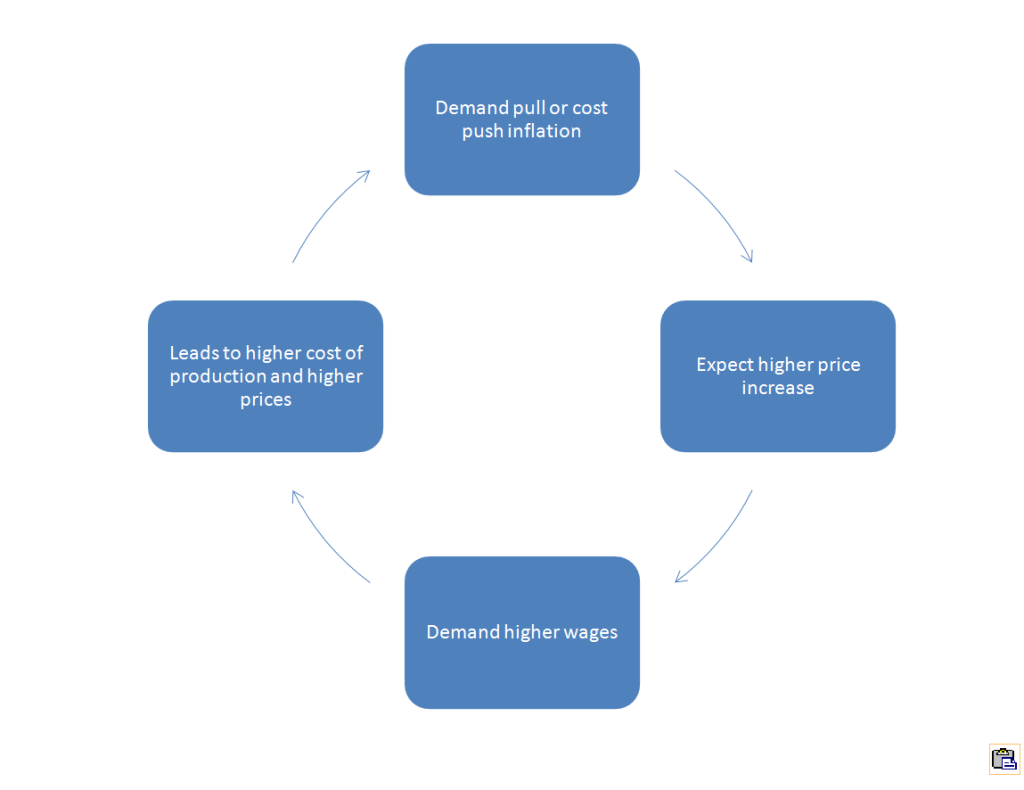
Built-in Inflation
- Interestingly expectations regarding the rate of future rise in prices also feeds into inflation.
- Suppose that workers in a country expect that the price of daily use items will increase in the near future, they will demand higher wages to maintain their standard of living. Assuming the demand is met, this will result in higher cost of production and increased prices, resulting in a cyclical effect.
- Built in inflation always needs a catalyst that originates in demand pull or cost push inflation. It does not occur on its own.
Is inflation good or bad?
Let’s imagine a scenario where the inflation rate is zero, i.e price of our predetermined basket of goods and services does not change at all. Naturally then wages also do not increase because companies will not be able to pay higher wages without denting their profits. Furthermore it is important to understand that inflation reaches zero when demand and supply in the economy are equal. In such a scenario, assuming there is no scope to export any item produced, no producer will need more workers and hence no new job opportunities will come up.
Naturally, higher the inflation rate, the better it is, right? Because higher the price rise, higher the profits and greater the wage increase? Unfortunately that’s not correct.
It is important to understand that inflation also redistributes purchasing power from people like retirees on fixed income to specific employees whose wages are indexed to inflation. For example let’s suppose a retiree earns a 5% return every year on his corpus of ₹1,00,00,000. This translates to annual income of ₹5,00,000 which is utilized for living expenses. As long as CPI every year remains below or at 5%, then the retiree will be able to maintain the same standard of living. However if the CPI increases by 6% in a specific year, then it can be safely assumed that the price of the basket of goods and services that the retiree was buying will also increase by 6%. So now the retiree will not be able to afford all the goods and services and will have to cut down on consumption, resulting in downgrading the standard of living.
In an extreme scenario, if the prices keep rising very fast consistently, it is better to consume all savings as soon as possible before high inflation reduces the purchasing power. In this case, individuals will not deposit any money into banks or financial institutions and will consume all earnings as soon as they receive it. Since banks / financial institutions do not receive any deposits, they will not be able to lend any money to borrowers, resulting in the break-down of the capital redistribution chain. Such an extreme scenario is called hyperinflation.
Hyperinflation is a very high and accelerating inflation rate, usually in excess of 50%. The below picture shows the consequence of such inflation.
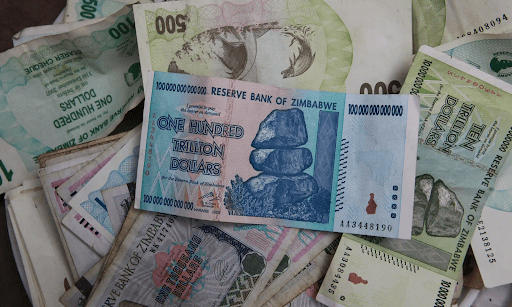
According to news reports this currency note from Zimbabwe would barely pay for a bus fare or loaf of bread in that country.
A consistent drop in price levels or negative inflation is called deflation. If prices drop consistently then people will keep postponing their consumption in anticipation of further drop in the future. This will result in lower sales… Click To TweetHence it is important to contain inflation at an optimum level – that will encourage consumption, prompt investment, create employment and lead to economic growth.

You may want to read
 The Power of Capital Expenditure (CapEx): 🏗️ Transforming Nations, Empowering People 💪
 Unlocking India’s Economic Potential: Consumption, Manufacturing, and the Road Ahead (2024 Outlook)