A step towards making smallcases more transparent

At smallcase, we understand that one of the most basic yet most important criteria for any financial product is transparency. We believe that our users should be fully aware of what they are investing in and what they should expect from such investments. Working in that direction, we’re happy to announce a slew of new and improved features.
At the end of 2019, we had introduced a lot of new features like valuation ratios, market-cap distributions, the option to download full index series of the smallcases, etc. to make smallcases transparent. You can check them out here.
Here are 3 new features that we worked on for you:
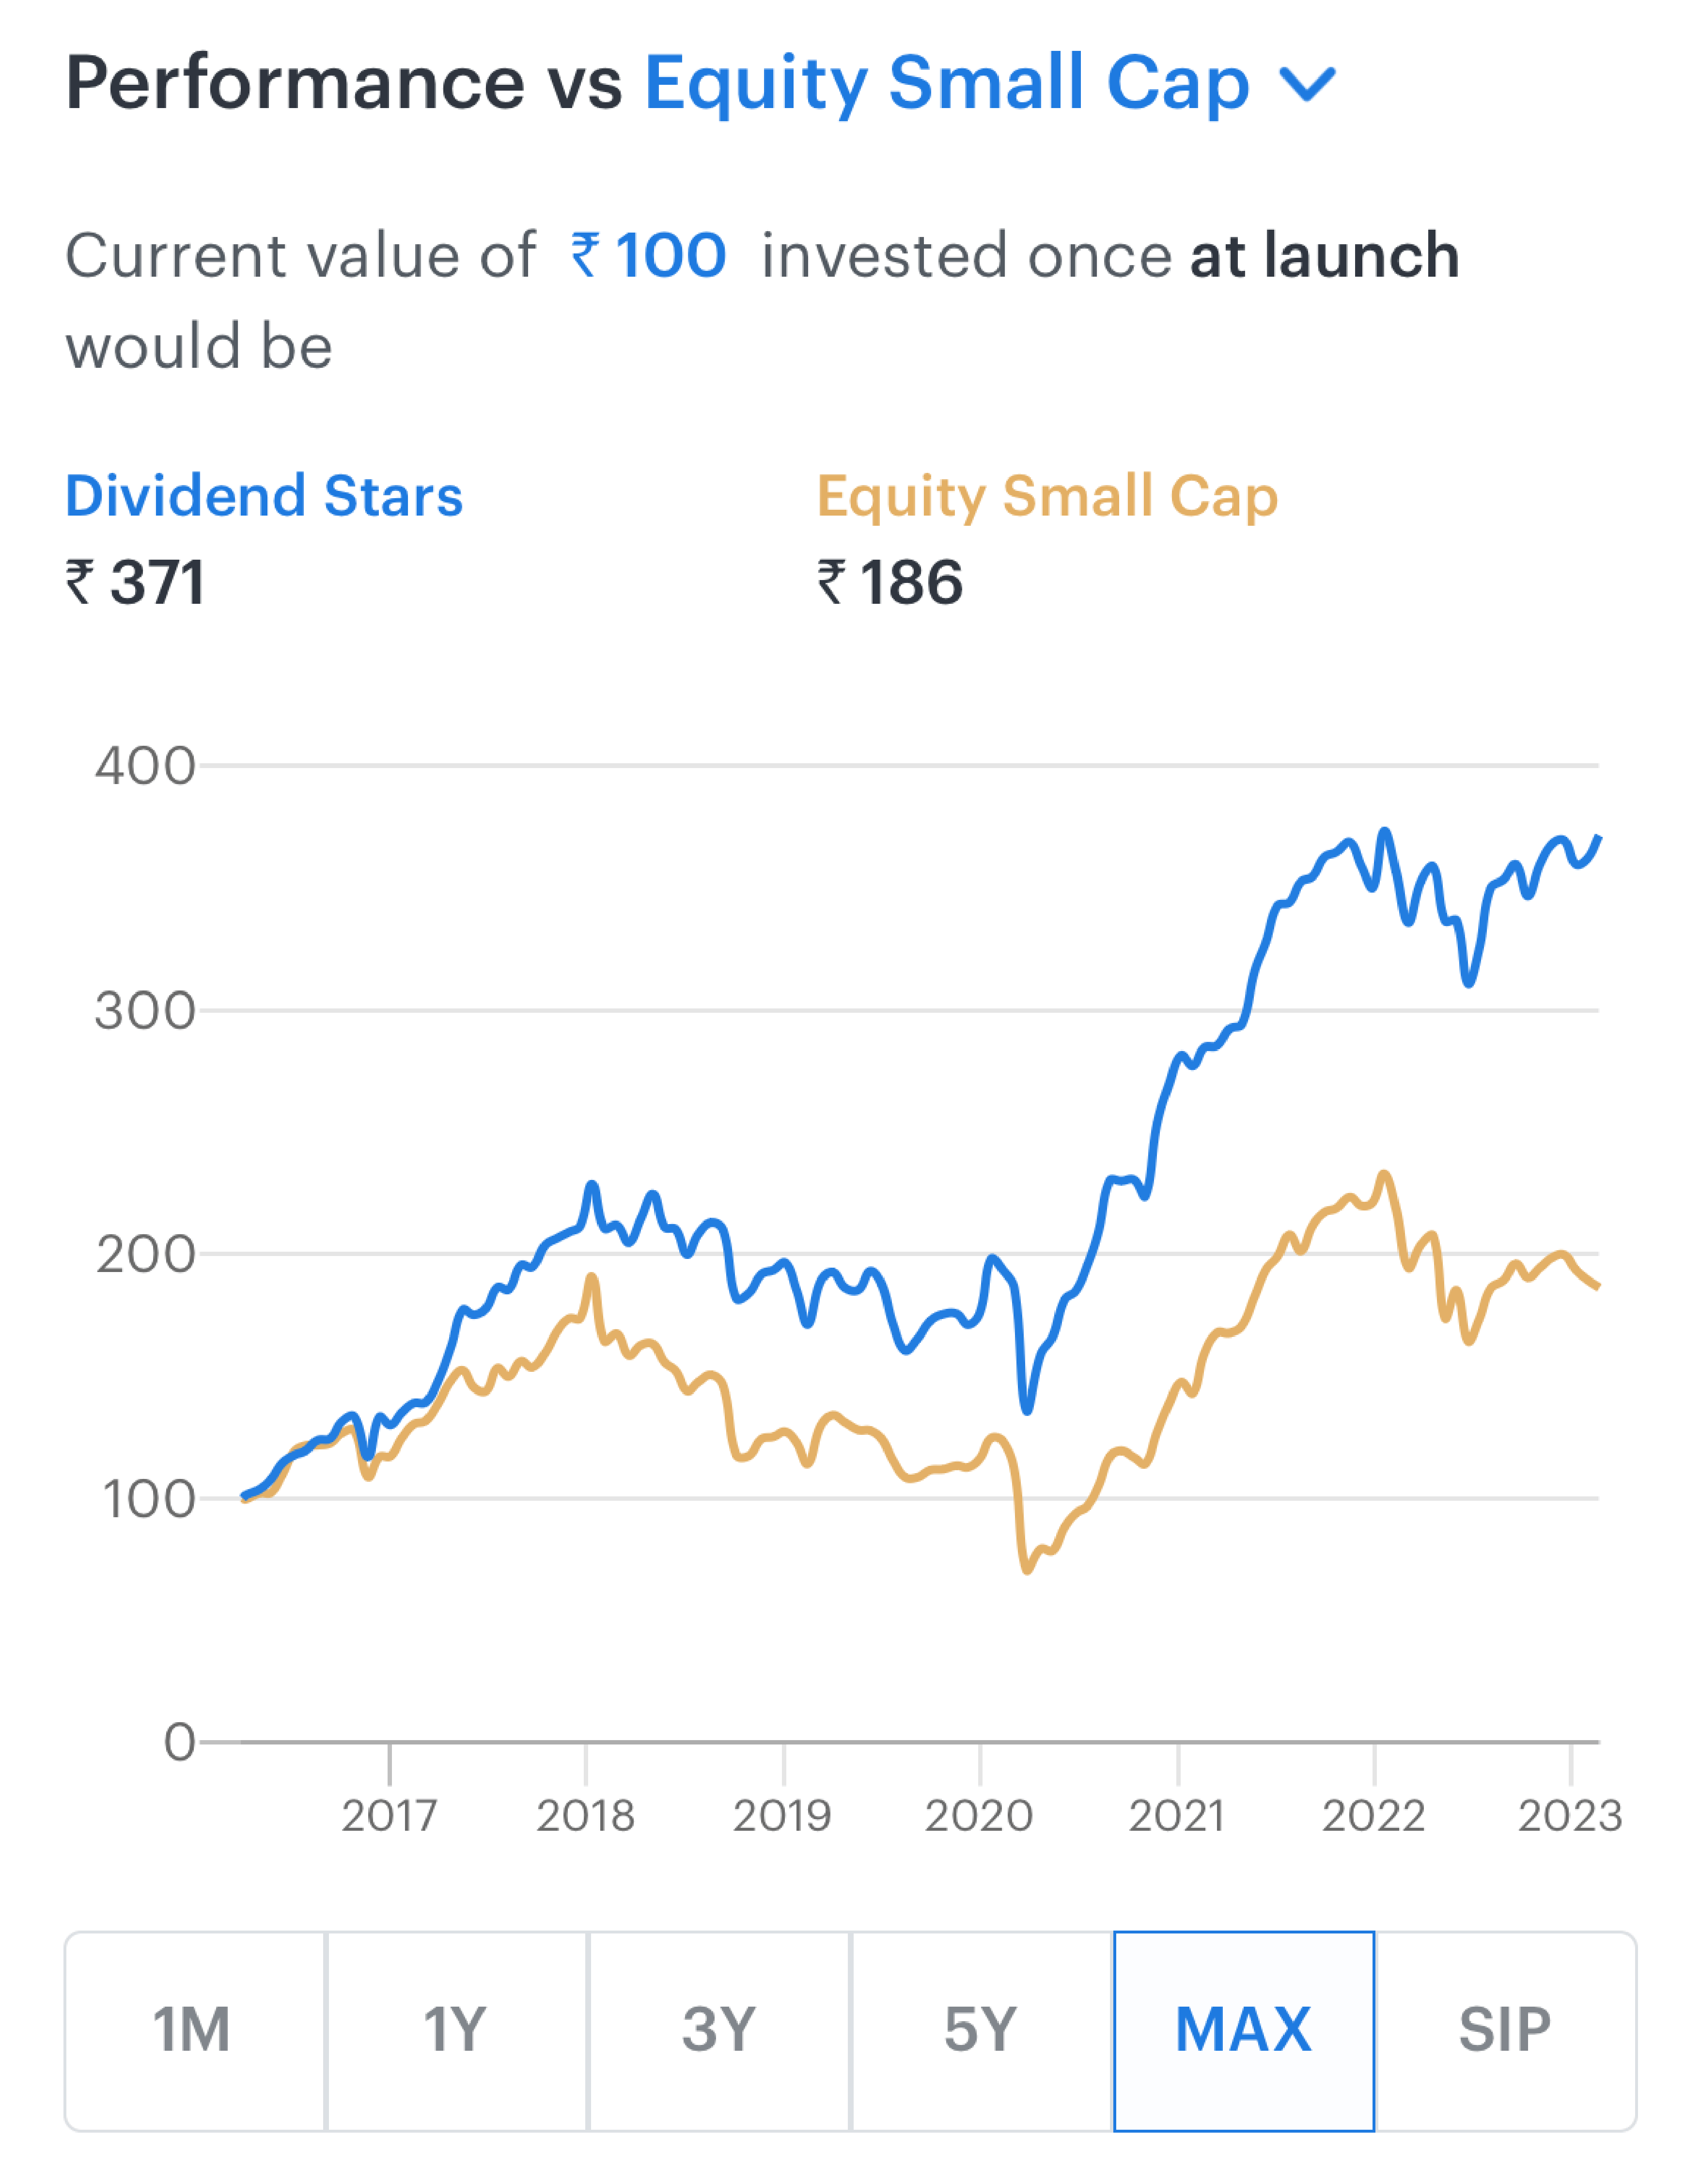
1) Past performance chart of a smallcase is now on live data only [Updated on 25th April 2022]
We used to show the backtested data in the Past Performance charts of smallcases, as it would help users analyze the strategy performance across longer time periods. Now, we have completely removed the backtested data from the Past Performance charts as well, to ensure that you don’t get confused between the live and backtested data while looking at the Past Performance chart.
Now, all the charts and numbers shown anywhere on the platform are only based on live data. If you are still keen to see the historical Manager’s backtested data of the smallcase, as calculated by the manager, you can find it on the factsheet of the smallcase.
2) We are shifting from ‘Risk’ to ‘Volatility’
In the financial world, risk can be interpreted in different ways – which often caused our users some confusion. Until now, we classified different smallcases on the basis of their risk. So, there were smallcases that were Low Risk, Moderate Risk and High Risk.
A ‘Low Risk’ smallcase was essentially one whose expectations of volatility in investment value were low. Similarly, a ‘High Risk’ smallcase was one with high expected volatility. However, we understood that this might be confusing for an investor to read and interpret in the way that we intend. Hence, we are now shifting from using the word ‘Risk’ to using ‘Volatility’. We believe that this label would be easier to understand and also conveys the idea correctly. Essentially, volatility represents the expected fluctuations in the smallcase value.
Volatility will be calculated based on live data only. This means that no backtested data is taken into consideration while calculating volatility. For more on how smallcase Volatility is calculated, read more here.
3) Improving the CAGR calculation methodology
Like Volatility, CAGR will also now be only calculated based on live data.
For smallcases that have been live for less than a year, CAGR will show the absolute performance of the smallcase during this period.
For periods greater than a year, CAGR would reflect the compounded annual growth rate calculated using the regular formula.
The idea behind including both – backtested and live performance, in the CAGR calculation was to give our users a better idea of what would be the expected performance of the smallcase over longer periods of time consisting of multiple economic cycles. However, this was not interpreted by our users in the way that we intended. Thus, we would not be including any backtested/simulated data in the CAGR calculations.
We hope these changes have made smallcases even more transparent than before. Feel free to share your suggestions on how we can further improve the transparency on the smallcase platform.

You may want to read
 New Cash Margin Requirements: Impact on smallcase Orders
 How to Make the Most of Your Mutual Fund Investments?
 Is LAMF a Better Alternative to Breaking Investments?